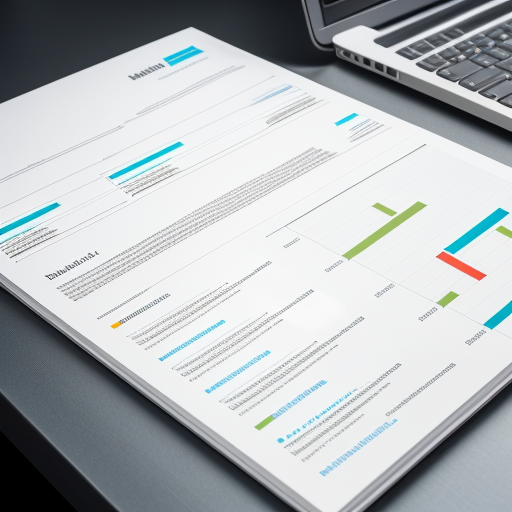
When creating a paginated report, the goal should be to make the information as accessible and easily understood as possible. To achieve this, a report should effectively communicate and convey information. Reports should also engage the reader and, more importantly, provide them with the information they need to make timely and credible decisions.
Reading Patterns
At Citizen39, we employ proven best practices when creating paginated reports. A critical aspect of our report designs is the reading patterns report readers use. Here are the most common reading patterns we consider when creating paginated reports:
F-Pattern
This is a typical pattern in which people’s eyes typically move horizontally across the upper part of the content area and then move down the page, scanning for keywords or points of interest. This pattern is particularly common for text-heavy content. For a paginated report, put the most critical information, such as section headers and key findings, along the top and left side of the page.
Z-Pattern
This is another typical pattern, particularly for less text-heavy pages. The reader’s gaze goes from left to right along the top (often where important navigation or heading information is), then diagonally to the opposite corner, and finally left to right again along the bottom. In the context of a report, the Z-Pattern can guide the reader’s attention to essential graphics, charts, or callouts.
Layer-Cake Pattern
This involves scanning headings and subheadings and skipping the standard text below. Readers look for headings or subheadings that match what they’re interested in. Ensure your headings and subheadings are descriptive and well-organized, and that critical information isn’t buried in paragraph text.
Spotted Pattern
This is where the reader’s eyes jump around, scanning for keywords, phrases, or sentence structures that catch their attention. Use bold, italics, or colour to highlight key points in your report.
One-sided Pattern
Some readers scan the content’s left side, looking for interesting points. This is similar to the F-Pattern but without the initial horizontal movement. To cater to this, left-align text and ensure that critical issues are easily identifiable.
Commitment Pattern
Some readers will thoroughly read your report from start to finish. This is less common, especially at first glance, but is more likely if your report is engaging and well-written and the reader is interested in the topic.
While these patterns can guide the design of your report, keep in mind that not all readers follow them, and some may switch between patterns. Furthermore, the best pattern may depend on the complexity and length of your report and your readers’ expected background. Lastly, always ensure your information is clear, concise, and well-organized, regardless of the specific reading pattern you design for.
Highlighting and Prioritizing Information
There’s more to just reading patterns though. Understanding how to help readers prioritize information is also critical to effective communication. Here are some strategies we use:
Highlight Key Points
Use visual cues such as bold text, underlining, italics, or colour to highlight important information. You can also use boxes or sidebars to draw attention to critical points.
Use Clear Headings and Subheadings
They should accurately represent the content that follows. Readers can scan these headings and subheadings to understand the content quickly.
Summarize
Provide a summary of key points at the beginning of each section. This helps readers understand what to expect and what the main takeaways are. Executive summaries are also helpful in lengthy reports.
Prioritize Information
Place the most critical information at the beginning of the report and of each section. This strategy, known as the “inverted pyramid,” is used by journalists to ensure readers get the most crucial information first.
Use Lists and Bullet Points
They are easier to scan than large blocks of text. Use them to break up information into manageable, easily digestible pieces.
Use Visuals
Charts, graphs, infographics, and other visuals can communicate information more quickly and clearly than text. They can be handy for presenting data or showing relationships between different pieces of information.
Use Clear, Simple Language
Avoid jargon and complex language as much as possible. Your goal should be to communicate information, not to impress readers with your vocabulary.
Consistent Formatting
Keep your formatting consistent throughout the document to avoid confusing your readers. This includes font sizes, heading styles, and presentation of lists or bullet points.
Remember, the goal is to make it as easy as possible for your readers to understand and remember the information you’re presenting. Therefore, the easier your report reads, the more likely your readers will engage with it and remove the key points.
Happy paginated report writing 🙂
About Citizen39
Citizen39 provides data consulting, including end-to-end data strategy design, planning, and data plan execution. Contact us today to learn more about our approach and how we can help you achieve your strategic goals and objectives with strategic data planning, business intelligence, and other data services.

Recent Comments